![]()
SEARCH
MENU
ESG Data
Environmental Performance
KPIs in the HASEKO Evolution Plan Medium-Term Business Plan
Results for each item will be published from FY2025.
| Initiatives and KPIs | Target | FY2025 | Calculation range | |
|---|---|---|---|---|
| Reduction of greenhouse gas (CO2) emissions | Scope 1 + Scope 2 (base year FY2020) | FY2030 (42%) | (21.7%) | Consolidated companies in Japan |
| Scope 2 | FY2026 0 | 5,666t-CO2 | Consolidated companies in Japan | |
| Scope 3 (base year FY2020) | FY2030 (13%) | 15.9% | Consolidated companies in Japan | |
| Introduce renewable energy power (including Group companies and offices) | FY2026 100% | 75.8% | Consolidated companies in Japan | |
| Projects using H-BA Concrete | FY2030 50% or more | 14.3% | Haseko Corporation | |
| Expand ZEH-M supply | Properties developed by Group | Each year 100% | 87.5% | *1 |
| Properties constructed by Group | FY2030 100% | 92.2% | *2 | |
- HASEKO Corporation, Haseko Real Estate Development, Sohgoh Real Estate, HASEKO Sougoh Development, Haseko Livenet
- HASEKO Corporation, Fujikensetsu
Environmental management system
| Item | Unit | FY2021 | FY2022 | FY2023 | FY2024 | FY2025 | Calculation range |
|---|---|---|---|---|---|---|---|
| Number of matters pointed out regarding ISO 14001 |
- | 0 | 0 | 0 | 0 | 0 | Haseko Corporation |
| Costs for research and technological development related to environment-related technologies | million yen | 194 | 188 | 315 | 218 | 544 | Haseko Corporation |
Climate change
| Item | Unit | FY2020 (base year) | FY2021 | FY2022 | FY2023 | FY2024 | FY2025 | Calculation range | |
|---|---|---|---|---|---|---|---|---|---|
| Scope 1 (tons-CO2) Direct emissions (e.g., fuel use) | t-CO2 | 38,596 | 40,487 | 34,486 | 52,224 | 45,571 | 41,591 | Consolidated companies in Japan | |
| t-CO2 | 33,636 | 34,379 | 30,869 | 45,449 | 39,886 | 36,100 | Haseko Corporation | ||
| Scope 2 (tons-CO2) Indirect emissions (e.g., electricity use) | t-CO2 | 21,786 | 24,258 | 18,302 | 8,349 | 4,766 | 5,666 | Consolidated companies in Japan | |
| t-CO2 | 10,366 | 11,531 | 6,129 | 680 | 493 | 760 | Haseko Corporation | ||
| Subtotal (Scope 1, 2) | t-CO2 | 60,382 | 64,745 | 52,788 | 60,573 | 50,336 | 47,257 | Consolidated companies in Japan | |
| t-CO2 | 44,002 | 45,910 | 36,998 | 46,129 | 40,379 | 36,861 | Haseko Corporation | ||
| Scope 3 (tons-CO2) Supply chain emissions | t-CO2 | 5,495,690 | 6,175,367 | 5,629,382 | 5,294,469 | 5,685,999 | 6,369,681 | Consolidated companies in Japan | |
| t-CO2 | 3,522,486 | 4,679,218 | 4,179,710 | 4,088,921 | 4,521,843 | 5,136,955 | Haseko Corporation | ||
| Category 1: Purchased goods and services | t-CO2 | 1,839,955 | 2,334,446 | 2,095,859 | 1,971,097 | 2,185,693 | 2,911,007 | Consolidated companies in Japan | |
| Category 2: Capital goods | t-CO2 | 55,398 | 58,285 | 73,138 | 43,254 | 43,301 | 77,675 | Consolidated companies in Japan | |
| Category 3: Fuel- and energy-related activities | t-CO2 | 10,107 | 9,874 | 10,166 | 9,898 | 10,462 | 9,876 | Consolidated companies in Japan | |
| Category 4: Upstream transportation and distribution | t-CO2 | 31,331 | 69,380 | 61,031 | 80,401 | 88,372 | 114,858 | Consolidated companies in Japan | |
| Category 5: Waste generated in operations | t-CO2 | 176,749 | 44,640 | 51,695 | 48,661 | 155,522 | 146,273 | Consolidated companies in Japan | |
| Category 6: Business travel | t-CO2 | 287 | 834 | 1,063 | 1,307 | 1,550 | 1,870 | Consolidated companies in Japan | |
| Category 7: Employee commuting | t-CO2 | 1,775 | 3,229 | 3,258 | 3,524 | 3,653 | 4,430 | Consolidated companies in Japan | |
| Category 8: Upstream leased assets | t-CO2 | - | - | - | - | - | - | Consolidated companies in Japan | |
| Category 9: Dowanstresm transportation and distribution | t-CO2 | - | 523 | 443 | - | - | 139 | Consolidated companies in Japan | |
| Category 10: Processing of sold products | t-CO2 | - | - | - | - | - | 244 | Consolidated companies in Japan | |
| Category 11: Use of sold products | t-CO2 | 3,283,284 | 3,551,478 | 3,242,616 | 3,012,318 | 3,057,574 | 2,978,374 | Consolidated companies in Japan | |
| Category 12: End-of-life treatment of sold products | t-CO2 | 69,946 | 76,179 | 56,474 | 78,806 | 76,474 | 81,762 | Consolidated companies in Japan | |
| Category 13: Downstream leased assets | t-CO2 | 26,858 | 26,498 | 33,639 | 45,203 | 63,398 | 43,173 | Consolidated companies in Japan | |
| Category 14: Franchises | t-CO2 | - | - | - | - | - | - | Consolidated companies in Japan | |
| Category 15: Investments | t-CO2 | - | - | - | - | - | - | Consolidated companies in Japan | |
| Total (Scope 1, 2, 3) | t-CO2 | 5,556,072 | 6,240,112 | 5,682,170 | 5,355,042 | 5,736,336 | 6,416,938 | Consolidated companies in Japan | |
| t-CO2 | 3,566,488 | 4,725,128 | 4,216,708 | 4,135,050 | 4,562,222 | 5,173,815 | Haseko Corporation | ||
- In principle, CO2 emissions are calculated by multiplying electricity and fuel consumption, as well as other activity data, by emission factors (emission intensity) published by the Ministry of the Environment and other relevant authorities.
- The reporting boundary comprises HASEKO Corporation and its major domestic consolidated subsidiaries. As the reporting boundary may change from year to year, comparisons with previous years may be affected by such changes.
Companies included in the FY2025 calculation scope:
HASEKO Corporation, Fujikensetsu, Hasec, Haseko Furnishing, Haseko Reform, Hosoda Corporation, Haseko Home, WOOD FRIENDS, FOREST NOTE, LUMBER LAND, Haseko Real Estate Development Holdings, Haseko Real Estate Development, Sohgoh Real Estate, Haseko Sohgoh Development, Haseko Urbest, Haseko Real Estate, Haseko Intech, Haseko Anesis, Haseko Management Holdings, Haseko Community, Haseko Community Kyushu, Haseko Community Okinawa, Haseko Livenet, Joint Property, Haseko Business Proxy, Haseko Senior Well Design, Furusato, Haseko Systems (now HASEKO Links), SHINRIN KOEN GC (29 companies in total).
| Indicators | Unit | FY2021 | FY2022 | FY2023 | FY2024 | FY2025 | Calculation range | |
|---|---|---|---|---|---|---|---|---|
| ZEH-M implementation rate | Properties developed by Group | % | - | - | - | - | 87.5 | *1 |
| Properties constructed by Group | % | - | - | - | - | 92.2 | *2 | |
- HASEKO Corporation, Haseko Real Estate Development, Sohgoh Real Estate, HASEKO Sougoh Development, Haseko Livenet
- HASEKO Corporation, Fujikensetsu
| Indicators | Unit | FY2021 | FY2022 | FY2023 | FY2024 | FY2025 | Calculation range | |
|---|---|---|---|---|---|---|---|---|
| Percentage of environment-conscious design proposals adopted per property | % | 98.4 | 97.8 | 98.3 | 98.4 | 96.1 | Haseko Corporation | |
| CO2 emissions calculation program (Comparison with standard value under the Act on the Improvement of Energy Consumption Performance of Buildings) |
CO2 reduction volume | tons-CO2/year | 5,369 | 11,237 | 12,085 | 16,789 | 12,103 | Haseko Corporation |
| CO2 reduction rate | % | 11.3 | 20.5 | 24.2 | 28.0 | 28.2 | Haseko Corporation | |
Biodiversity
| Indicators | Unit | FY2021 | FY2022 | FY2023 | FY2024 | FY2025 | Calculation range |
|---|---|---|---|---|---|---|---|
| Number of ABINC-certified properties (designed/constructed properties) | - | 4 | 2 | 5 | 12 | 9 | Haseko Corporation |
Resource circularity / Pollution prevention
FY2025 results are scheduled to be updated in or around August 2026.
| Indicators | Unit | FY2020 | FY2021 | FY2022 | FY2023 | FY2024 | Calculation range | |
|---|---|---|---|---|---|---|---|---|
| Volume of waste generated and discharged | Construction activities | thousand tons | 616.8 | 1,260.2 | 947.2 | 718.5 | 767.4 | Haseko Corporation*1 |
| Office activities | tons | 14.4 | 13.5 | 14.9 | 14.5 | 14.9 | *2 | |
| Paper usage | Office activities | ten thousand sheets | 1,362 | 1,267 | 1,035 | 956 | 857 | *3 |
- FY2020: Completed works at 124 worksites (new building works: 105, demolition works: 19)
FY2021: Works during target period at 310 worksites (new building works: 285, demolition works: 25)
FY2022: Works during target period at 336 worksites (new building works: 299, demolition works: 37)
FY2023: Works during target period at 367 worksites (new building works: 311, demolition works: 56)
FY2024: Works during target period at 351 worksites (new building works: 300, demolition works: 51)
(scope of calculations has been revised since FY2021) - Shiba Head Office Building/Osaka Hiranomachi Building
- Shiba Head Office Building/Osaka Hiranomachi Building/Yokohama Branch/Nagoya Branch/Haseko Technical Center
| Indicators | Unit | FY2020 | FY2021 | FY2022 | FY2023 | FY2024 | Calculation range |
|---|---|---|---|---|---|---|---|
| Volume of construction waste discharged | thousand tons | 616.8 | 1,260.2 | 947.2 | 718.5 | 767.4 | Haseko Corporation*1 |
| Volume of recycled waste | thousand tons | 608.1 | 1,225.8 | 940.8 | 712.8 | 755.4 | Haseko Corporation*1 |
| Final amount of waste processed | thousand tons | 8.7 | 34.3 | 6.4 | 5.7 | 12.0 | Haseko Corporation*1 |
| Recycling rate | % | 98.6 | 97.3 | 99.3 | 99.2 | 98.4 | Haseko Corporation*1 |
- FY2020: Completed works at 124 worksites (new building works: 105, demolition works: 19)
FY2021: Works during target period at 310 worksites (new building works: 285, demolition works: 25)
FY2022: Works during target period at 336 worksites (new building works: 299, demolition works: 37)
FY2023: Works during target period at 367 worksites (new building works: 311, demolition works: 56)
FY2024: Works during target period at 351 worksites (new building works: 300, demolition works: 51)
(scope of calculations has been revised since FY2021)
| Item | Unit | FY2020 | FY2021 | FY2022 | FY2023 | FY2024 | Calculation range |
|---|---|---|---|---|---|---|---|
| Steel for electric furnace (reinforcing steel) | thousand tons | 187 | 169 | 195 | 196 | 197 | Haseko Corporation |
| Steel for electric furnace (steel frame) | thousand tons | - | 2 | 5 | 12 | 21 | Haseko Corporation |
| Blast furnace cement and freshly-mixed concrete | thousand cubic meters | 208 | 225 | 208 | 223 | 274 | Haseko Corporation |
| Recycled tiles | thousand cubic meters | 226 | 220 | 246 | 218 | 213 | Haseko Corporation |
| Recycled plasterboards | thousand cubic meters | 4,537 | 4,900 | 4,828 | 4,971 | 5,023 | Haseko Corporation |
| Water-saving toilet bowl | thousand units | 15 | 16 | 17 | 17 | 17 | Haseko Corporation |
| Water-saving showerheads*1 | thousand units | - | - | - | - | 19 | Haseko Corporation |
| LED lighting equipment | thousand units | 194 | 304 | 176 | 190 | 234 | Haseko Corporation |
- Water-saving showerheads were added to the list in fiscal 2024.
| Item | Unit | FY2020 | FY2021 | FY2022 | FY2023 | FY2024 | Calculation range |
|---|---|---|---|---|---|---|---|
| Reinforcing steel | thousand tons | 187 | 169 | 195 | 196 | 197 | Haseko Corporation |
| Steel frame | thousand tons | 5 | 15 | 10 | 32 | 30 | Haseko Corporation |
| Freshly-mixed concrete | thousand cubic meters | 1,337 | 1,242 | 1,341 | 1,304 | 1,657 | Haseko Corporation |
| Item | Unit | FY2020 | FY2021 | FY2022 | FY2023 | FY2024 | Calculation range | ||
|---|---|---|---|---|---|---|---|---|---|
| Hazardous substances | Amount of specially controlled industrial waste processed | tons | - | 1,219 | 310 | 1,486 | 282 | Haseko Corporation | |
| Amount of industrial waste containing asbestos processed | tons | - | 296 | 1,503 | 3,066 | 2,775 | Haseko Corporation | ||
| Amount of industrial waste containing mercury processed | tons | - | 26 | 113 | 11 | 17 | Haseko Corporation | ||
| Amount of CFC refrigerant gas collected | tons | - | 3.0 | 1.5 | 79.7 | 0.1 | Haseko Corporation | ||
| Amount of Halon gas collected | tons | - | 0.7 | 0.0 | 0.4 | 0.7 | Haseko Corporation | ||
| Atmospheric pollutants | NOx emissions | Electric power | tons | - | 10.0 | 9.6 | 12.5 | 12.3 | Haseko Corporation |
| Light oil | tons | - | 237.6 | 221.0 | 362.7 | 274.3 | Haseko Corporation | ||
| Total | tons | - | 247.6 | 230.5 | 375.1 | 286.6 | Haseko Corporation | ||
| SOx emissions | Electric power | tons | - | 4.2 | 4.0 | 5.2 | 5.1 | Haseko Corporation | |
| Light oil | tons | - | 51.0 | 47.4 | 77.8 | 58.9 | Haseko Corporation | ||
| Total | tons | - | 55.2 | 51.4 | 83.0 | 64.0 | Haseko Corporation | ||
- Calculated with reference to the Architectural Institute of Japan’s “LCA Guidelines for Buildings”
| Item | Unit | FY2020 | FY2021 | FY2022 | FY2023 | FY2024 | Calculation range | |
|---|---|---|---|---|---|---|---|---|
| Municipal water consumption*1 | thousand cubic meters | 409 | 975 | 685 | 768 | 674 | Total | |
| Construction sites | thousand cubic meters | 387 | 950 | 660 | 742 | 647 | Haseko Corporation*3 | |
| Office activities | thousand cubic meters | 21 | 25 | 25 | 26 | 27 | *4 | |
| Wastewater discharge*2 | thousand cubic meters | 20,947 | 400 | 762 | 297 | 278 | Total | |
| Construction sites | thousand cubic meters | 20,928 | 377 | 739 | 272 | 252 | Haseko Corporation*3 | |
| Office activities | thousand cubic meters | 19 | 23 | 23 | 25 | 26 | *4 | |
- Aggregated amount of water taken from public water. Does not include intake from surface water, subsurface water, marine water, or external effluent.
- Aggregated amount of water discharged to public water. Does not include discharge to surface water, subsurface water, or marine water. Water discharged to public water (sewers) is purified at public water treatment plants before being released into rivers and other bodies of water.
- Construction activities (scope of calculations has been revised since FY2021)
FY2020: Completed works at 124 worksites (new building works: 105, demolition works: 19)
FY2021: Works during target period at 310 worksites (new building works: 285, demolition works: 25)
FY2022: Works during target period at 336 worksites (new building works: 299, demolition works: 37)
FY2023: Works during target period at 367 worksites (new building works: 311, demolition works: 56)
FY2024: Works during target period at 351 worksites (new building works: 300, demolition works: 51) - Office activities
Shiba Head Office Building/Osaka Hiranomachi Building
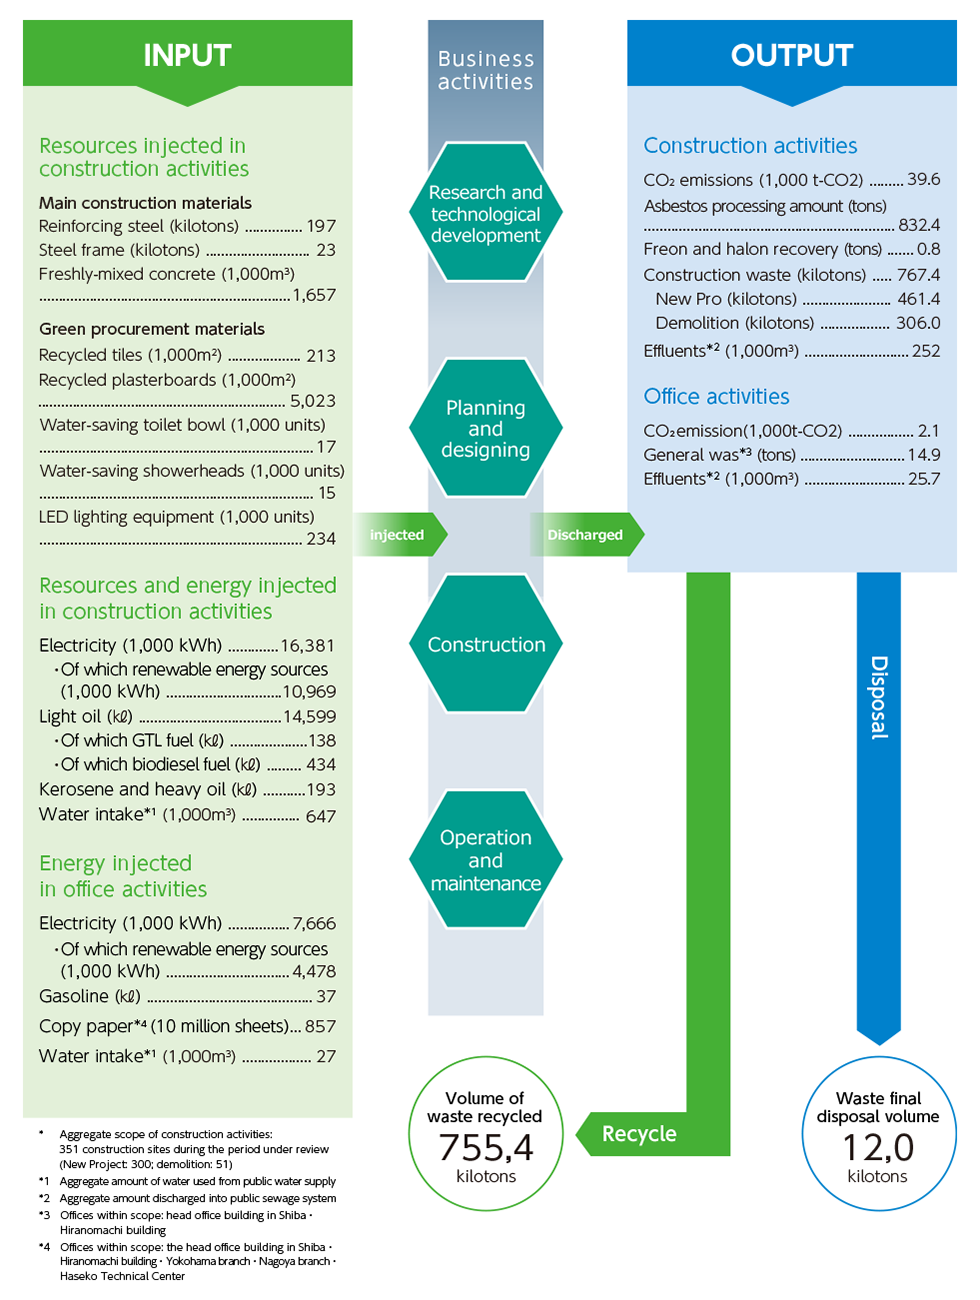
Flow of materials (FY2024)
FY2025 results are scheduled to be updated in or around August 2026.
Third-party verification of environmental information
To ensure transparency and accuracy, the Haseko Group receives third-party verification from the Japan Quality Assurance Organization (JQA) for CO2 emissions (Scope 1, Scope 2, Scope 3), Energy Usage, and Renewable Energy Usage.
Haseko Group will continuously strive to improve precision by effectively utilizing third-party verifications.
Responses to CDP climate change questionnaires
Please see below for our responses to CDP climate change questionnaires.
- CDP is a non-governmental organization that runs the global environmental information disclosure system for companies and other organizations.
Social Performance
Initiative targets
Results for each item will be published from FY2025.
◎: KPIs in the HASEKO Evolution Plan medium-term business plan
| Initiatives and KPIs | Target | FY2025 | Calculation range | |
|---|---|---|---|---|
| Personnel and organization | Achievement rate of new graduate recruitment plan | 100% | 90.2% | Consolidated companies in Japan |
| Turnover rate of full-time employees | 5.0% | 5.5% | Consolidated companies in Japan | |
| Personnel development | Percentage of employees holding key qualifications*1 | 100% | 87.2% | Consolidated companies in Japan |
| Haseko Business College Participation Rate | 30% | 7.0% | Consolidated companies in Japan | |
| ◎Ratio of DX promotion personnel | 20% (FY2030) | 5.3% | Consolidated companies in Japan | |
| Diversity & inclusion | Percentage of women among new graduates hired | 30% | 33.0% | Consolidated companies in Japan |
| Percentage of female employees | 30% or more | 33.0% | Consolidated companies in Japan | |
| ◎Percentage of female managers | 12% (FY2030) | 11.5% | Consolidated companies in Japan | |
| Percentage of male workers using the childcare participation system*2 | 100% | 97.2% | Consolidated companies in Japan | |
| Percentage of childcare leave taken by male workers | 50% | 76.8% | Consolidated companies in Japan | |
| Percentage of disabled persons employed | 2.5% | 2.75% | Group application*3 | |
| Labor environment | ◎Implementation rate of operation with 8 days closed every 4 weeks | 100% (FY2027) | 78.1% | Haseko Corporation |
| Implementation rate*3 of operation with 8 days off every 4 weeks (104 days off annually) | 100% | 94.7% | Haseko Corporation | |
| Occupational health and safety | Fatal and serious accidents/disasters | None | 0 | Haseko Corporation |
| Frequency rate of occupational accidents | 0.60 or less | 0.15 | Haseko Corporation | |
| Severity rate of occupational accidents | 0.01 or less | 0.01 | Haseko Corporation | |
| Health and productivity management | Percentage of employees undergoing health checks | 100% | 100% | All Group companies |
| Percentage of employees taking stress checks | 100% | 99.4% | All Group companies | |
| ◎Percentage of persons eligible for specific health guidance | 15% or less (FY2030) | 15.4% | All Group companies | |
| Implementation rate of the specific health guidance | 55% | 56.6% | All Group companies | |
| Certification under the Health & Productivity Management Outstanding Organizations Recognition Program | White 500 certification acquired | White 500 certification acquired | *4 | |
- Real estate transaction specialist, First-class architect, First-class building construction management engineer, Licensed representative of condominium management companies, Property manager, First-class plumbing construction management engineer, First-class electrical construction management engineer, First-class civil engineering construction management engineer, Interior coordinator, Mansion reform manager
- The childcare participation system refers to childcare leave and spousal childbirth leave.
- Companies included in the denominator for group-wide application are as follows.
Haseko Corporation, Haseko Systems (now HASEKO Links), Haseko Urbest, Haseko Community, Haseko Livenet, Haseko Reform, Haseko Anesis Corporation, and Haseko Real Estate Development. - Haseko Corporation, Haseko Anesis, Haseko Property Management Holdings, Haseko Community, Haseko Reform, Haseko Livenet, Haseko Urbest, Haseko Real Estate, Haseko Well Center
Human capital
| Item | Unit | FY2021 | FY2022 | FY2023 | FY2024 | FY2025 | Calculation range | ||
|---|---|---|---|---|---|---|---|---|---|
| Number of employees | Male | persons | 2,060 | 2,020 | 2,048 | 2,114 | 2,240 | Haseko Corporation | |
| Managers | persons | 888 | 908 | 934 | 993 | 983 | Haseko Corporation | ||
| Regular employees | persons | 1,172 | 1,112 | 1,114 | 1,121 | 1,257 | Haseko Corporation | ||
| Female | persons | 373 | 379 | 399 | 442 | 471 | Haseko Corporation | ||
| Managers | persons | 41 | 41 | 46 | 51 | 54 | Haseko Corporation | ||
| Regular employees | persons | 332 | 338 | 353 | 391 | 417 | Haseko Corporation | ||
| Total | persons | 2,433 | 2,399 | 2,447 | 2,556 | 2,711 | Haseko Corporation | ||
| Managers | persons | 929 | 949 | 980 | 1,044 | 1,037 | Haseko Corporation | ||
| Regular employees | persons | 1,504 | 1,450 | 1,467 | 1,512 | 1,674 | Haseko Corporation | ||
| Number of Group employees | Male | persons | 5,440 | 5,194 | 5,292 | 5,483 | 5,892 | *1 | |
| Managers | persons | 2,182 | 2,122 | 2,158 | 2,286 | 2,338 | *1 | ||
| Regular employees | persons | 3,258 | 3,072 | 3,134 | 3,197 | 3,554 | *1 | ||
| Female | persons | 2,410 | 2,279 | 2,461 | 2,732 | 2,902 | *1 | ||
| Managers | persons | 228 | 231 | 244 | 270 | 305 | *1 | ||
| Regular employees | persons | 2,182 | 2,048 | 2,217 | 2,462 | 2,597 | *1 | ||
| Total | persons | 7,850 | 7,473 | 7,753 | 8,215 | 8,794 | *1 | ||
| Managers | persons | 2,410 | 2,353 | 2,402 | 2,556 | 2,643 | *1 | ||
| Regular employees | persons | 5,440 | 5,120 | 5,351 | 5,659 | 6,151 | *1 | ||
| Percentage of employees by age | Up to 29 years old | % | 25.8 | 24.9 | 25.2 | 27.5 | 30.2 | Haseko Corporation | |
| 30 to 39 years old | % | 27.3 | 28.3 | 28.6 | 27.8 | 27.1 | Haseko Corporation | ||
| 40 to 49 years old | % | 15.4 | 16.3 | 17.8 | 17.9 | 17.9 | Haseko Corporation | ||
| 50 to 59 years old | % | 23.8 | 23.6 | 21.2 | 19.0 | 16.5 | Haseko Corporation | ||
| 60 years old and above | % | 7.7 | 6.9 | 7.2 | 7.8 | 8.3 | Haseko Corporation | ||
| Percentage of temporary staff among all personnel | % | 22.0 | 23.3 | 25.4 | 25.8 | 24.3 | Haseko Corporation | ||
| Average age | years | 41.2 | 41.1 | 40.8 | 40.2 | 39.4 | Haseko Corporation | ||
| Average number of years of service | Haseko Group | years | - | 13.6 | 13.2 | 12.8 | 12.4 | Consolidated companies in Japan | |
| Male | years | - | 15.0 | 14.6 | 14.3 | 13.7 | Consolidated companies in Japan | ||
| Female | years | - | 10.4 | 10.1 | 9.8 | 9.9 | Consolidated companies in Japan | ||
| Haseko Corporation | years | 16.9 | 16.8 | 16.8 | 15.5 | 14.7 | Haseko Corporation | ||
| Male | years | 18.2 | 18.0 | 17.5 | 16.6 | 15.7 | Haseko Corporation | ||
| Female | years | 10.1 | 10.6 | 10.9 | 10.6 | 10.4 | Haseko Corporation | ||
| Annual turnover ratio | Haseko Group | % | 4.9 | 5.3 | 5.7 | 5.1 | 5.5 | Consolidated companies in Japan | |
| Haseko Corporation | % | 2.2 | 3.6 | 3.5 | 2.8 | 3.0 | Haseko Corporation | ||
| Total number of newly hired employees (New Graduates / Mid-Career) | Haseko Group | persons | 586 | 599 | 833 | 967 | 916 | *1 | |
| Male | persons | 343 | 350 | 450 | 507 | 559 | *1 | ||
| Female | persons | 243 | 249 | 383 | 460 | 357 | *1 | ||
| Haseko Corporation | persons | 141 | 127 | 190 | 245 | 302 | Haseko Corporation | ||
| Male | persons | 107 | 96 | 150 | 184 | 252 | Haseko Corporation | ||
| Female | persons | 34 | 31 | 40 | 61 | 50 | Haseko Corporation | ||
| Number of new graduates hired | Haseko Group | persons | 352 | 346 | 420 | 419 | 543 | *1 | |
| Male | persons | 221 | 222 | 264 | 266 | 364 | *1 | ||
| Female | persons | 131 | 124 | 156 | 153 | 179 | *1 | ||
| Haseko Corporation | persons | 107 | 98 | 134 | 152 | 238 | Haseko Corporation | ||
| Male | persons | 77 | 74 | 105 | 116 | 195 | Haseko Corporation | ||
| Female | persons | 30 | 24 | 29 | 36 | 43 | Haseko Corporation | ||
| Number of reemployed persons | Haseko Group | persons | 189 | 232 | 281 | 320 | 347 | Consolidated companies in Japan | |
| Haseko Corporation | persons | 80 | 101 | 128 | 146 | 146 | Haseko Corporation | ||
- FY2021: All Group companies in Japan, FY2022 onward: Consolidated companies in Japan
| Item | Unit | FY2021 | FY2022 | FY2023 | FY2024 | FY2025 | Calculation range | ||
|---|---|---|---|---|---|---|---|---|---|
| Percentage of female employees | Haseko Group | % | 30.7 | 30.5 | 31.7 | 33.3 | 33.0 | *1 | |
| Haseko Corporation | % | 15.3 | 15.8 | 16.3 | 17.3 | 17.4 | Haseko Corporation | ||
| Percentage of female managers | Haseko Group | % | 9.5 | 9.8 | 10.2 | 10.6 | 11.5 | *1 | |
| Haseko Corporation | % | 4.4 | 4.3 | 4.7 | 4.9 | 5.2 | Haseko Corporation | ||
| Percentage of women employees in new hires (New Graduates / Mid-Career) | Haseko Group | % | 41.5 | 41.6 | 46.0 | 47.6 | 39.0 | *1 | |
| Haseko Corporation | % | 24.1 | 24.4 | 21.1 | 24.9 | 16.6 | Haseko Corporation | ||
| Percentage of women among new graduates hired | Haseko Group | % | 37.2 | 35.8 | 37.1 | 36.5 | 33.0 | *1 | |
| Haseko Corporation | % | 28.0 | 24.5 | 21.6 | 23.7 | 18.1 | Haseko Corporation | ||
| Percentage of disabled persons employed | % | 2.20 | 2.42 | 2.38 | 2.48 | 2.75 | Group application*2 | ||
| Percentage of annual paid holidays taken | Haseko Group | % | 67.3 | 71.1 | 70.0 | 72.2 | 75.7 | *4 | |
| Haseko Corporation | % | 63.3 | 66.1 | 67.4 | 68.6 | 71.8 | Haseko Corporation | ||
| Percentage of parental leave taken | Haseko Group | Male | % | 17.5 | 39.4 | 36.0 | 59.4 | 76.8 | Consolidated companies in Japan |
| Female | % | 100 | 100 | 97.8 | 100 | 85.9 | Consolidated companies in Japan | ||
| Haseko Corporation | Male | % | 20.9 | 40.7 | 36.0 | 60.8 | 82.8 | Haseko Corporation | |
| Female | % | 100 | 97.1 | 100 | 100 | 79.4 | Haseko Corporation | ||
| Average number of days of childcare leave acquired by male employees | days | 50.8 | 26.4 | 30.4 | 44.1 | 40.1 | Consolidated companies in Japan | ||
| Acquisition ratio of time off for children's events | Haseko Group | Male | % | 44.8 | 44.7 | 47.5 | 52.0 | 57.7 | Consolidated companies in Japan |
| Female | % | 50.4 | 55.2 | 50.7 | 49.8 | 92.7 | Consolidated companies in Japan | ||
| Haseko Corporation | Male | % | 46.8 | 45.6 | 46.7 | 51.5 | 58.5 | Haseko Corporation | |
| Female | % | 50.0 | 41.2 | 38.2 | 46.3 | 58.6 | Haseko Corporation | ||
| Acquisition ratio of spouse maternity leav | Haseko Group | % | 36.2 | 40.0 | 55.1 | 54.4 | 68.5 | Consolidated companies in Japan | |
| Haseko Corporation | % | 42.2 | 44.0 | 64.0 | 70.9 | 73.1 | Haseko Corporation | ||
| Male employee childcare participation program (childcare leave and spouse maternity leave) | % | - | - | - | 81.1 | 97.2 | Consolidated companies in Japan | ||
| Percentage of employees returning to work after taking maternity/parental leave | % | 100 | 98 | 96 | 100 | 100 | Haseko Corporation | ||
| Number of employees taking nursing care leave | persons | 0 | 3 | 3 | 2 | 2 | Haseko Corporation | ||
| Average annual salaries | yen | 9,104,949 | 9,418,772 | 9,634,304 | 10,578,846 | 10,399,403 | Haseko Corporation | ||
| Gender pay gap | Haseko Group | Mean gender pay gap of all employees | % | - | 63.3 | 64.3 | 65.0 | 68.1 | *3 |
| Mean gender pay gap of full-time employees | % | - | 59.4 | 57.6 | 57.3 | 60.2 | *3 | ||
| Mean gender pay gap of part-time and non-permanent workers | % | - | 95.5 | 97.4 | 91.9 | 98.4 | *3 | ||
| Haseko Corporation | Mean gender pay gap of all employees | % | - | 61.3 | 61.7 | 63.4 | 67.0 | Haseko Corporation | |
| Mean gender pay gap of full-time employees | % | - | 61.1 | 61.5 | 63.3 | 66.9 | Haseko Corporation | ||
| Mean gender pay gap of part-time and non-permanent workers | % | - | 71.7 | 68.6 | 53.3 | 60.0 | Haseko Corporation | ||
| Total working hours per person | hours | 2,267 | 2,261 | 2,244 | 2,178 | 2,143 | Haseko Corporation | ||
| Average monthly overtime hours | Haseko Group | hours | - | - | - | 19.1 | 18.4 | Consolidated companies in Japan | |
| Haseko Corporation | hours | - | - | - | 28.0 | 25.8 | Haseko Corporation | ||
| Implementation rate of operation with 8 days closed every 4 weeks | % | - | - | - | 30.4 | 78.1 | Haseko Corporation | ||
| Implementation rate of operation with 8 days off every 4 weeks (104 days off annually) | % | - | - | 81.0 | 83.9 | 94.7 | Haseko Corporation | ||
- FY2021: All Group companies in Japan, FY2022 onward: Consolidated companies in Japan
- Companies included in the denominator of the group application are as follows.
Haseko Corporation, HASEKO Links, Haseko Urbest, Haseko Community, Haseko Livenet, Haseko Reform, Haseko Anesis Corporation, and Haseko Real Estate Development. - Haseko Corporation and its consolidated subsidiaries with 301 or more employees
- FY2021 to FY2023: All Group companies in Japan, FY2024 onward: Consolidated companies in Japan
| Item | Unit | FY2021 | FY2022 | FY2023 | FY2024 | FY2025 | Calculation range | ||
|---|---|---|---|---|---|---|---|---|---|
| Education and training expenses for human resources development | million yen | 120 | 164 | 130 | 177 | 235 | Haseko Corporation | ||
| Hours spent on education and training for human resources development | hours | 157,024 | 150,736 | 150,779 | 206,031 | 293,854 | Haseko Corporation | ||
| Percentage of employees holding key qualifications*1 | % | - | - | - | 82.2 | 87.2 | Consolidated companies in Japan | ||
| Pass rate for main tests | Group | Real estate transaction specialist | % | - | 80.2 | 86.6 | 87.0 | 89.3 | All Group companies |
| First-class architect | % | - | 43.0 | 44.8 | 38.7 | 41.9 | All Group companies | ||
| First-class building construction management engineer | % | - | 71.9 | 78.4 | 81.2 | 70.3 | All Group companies | ||
| Haseko Corporation | Real estate transaction specialist | % | 100 | 90.9 | 95.5 | 91.4 | 92.3 | Haseko Corporation | |
| First-class architect | % | 35.4 | 43.0 | 47.6 | 40.9 | 38.3 | Haseko Corporation | ||
| First-class building construction management engineer | % | 96.9 | 82.1 | 87.5 | 88.6 | 88.4 | Haseko Corporation | ||
| Haseko Business College Participation Rate | % | - | - | - | 12.4 | 7.0 | Consolidated companies in Japan | ||
| Percentage of DX promotion personnel | % | - | - | - | - | 5.3 | Consolidated companies in Japan | ||
- Real estate transaction specialist, First-class architect, First-class building construction management engineer, Licensed representative of condominium management companies, Property manager, First-class plumbing construction management engineer, First-class electrical construction management engineer, First-class civil engineering construction management engineer, Interior coordinator, Mansion reform manager
Occupational safety and health
| Item | Unit | FY2021 | FY2022 | FY2023 | FY2024 | FY2025 | Calculation range | |
|---|---|---|---|---|---|---|---|---|
| Number of disasters involving deaths/serious accidents | Haseko Group | - | 0 | 0 | 0 | 0 | 0 | Consolidated |
| Employees of business partners | - | 0 | 0 | 3 | 1 | 0 | *1 | |
| Frequency rate of occupational accidents | 4 or more days of absence from work | - | 0.22 | 0.28 | 0.14 | 0.28 | 0.15 | Haseko Corporation*2 |
| 1 or more days of absence from work | - | 0.45 | 0.53 | 0.34 | 0.52 | 0.27 | Haseko Corporation*2 | |
| Severity rate of occupational accidents | - | 0.00 | 0.00 | 0.51 | 0.26 | 0.01 | Haseko Corporation*2 | |
- This refers to all partner companies involved in operations at construction sites managed by Haseko Corporation, Haseko Reform, Fujikensetsu, Haseko Furnishing, and Hosoda Corporation.
- Including partner companies
Health and productivity management
| Item | Unit | FY2021 | FY2022 | FY2023 | FY2024 | FY2025 | Calculation range |
|---|---|---|---|---|---|---|---|
| Percentage of employees undergoing health checks | % | 100 | 100 | 100 | 100 | 100 | All Group companies |
| Percentage of employees undergoing PET-CT examination | % | 79 | 80 | 80 | 81 | Under calculation | All Group companies |
| Percentage of employees taking stress checks | % | 96.7 | 97.2 | 98.2 | 99.3 | 99.4 | All Group companies |
| Percentage of persons eligible for specific health guidance | % | - | - | - | 16.4 | 15.4 | All Group companies |
| Implementation rate of the specific health guidance | % | 42.4 | 52.3 | 44.1 | 55.6 | 56.6 | All Group companies |
| Certification under the Health & Productivity Management Outstanding Organizations Recognition Program | - | Certification | White 500 certification | White 500 certification | White 500 certification | White 500 certification | *1 |
- Haseko Corporation, Haseko Anesis Corporation, Haseko Property Management Holdings, Haseko Community, Haseko Reform, Haseko Livenet, Haseko Urbest, Haseko Real Estate, Haseko Well Center
Enhancing safety and quality in buildings and services
| Item | Unit | FY2021 | FY2022 | FY2023 | FY2024 | FY2025 | Calculation range |
|---|---|---|---|---|---|---|---|
| Number of matters pointed out by external examination regarding ISO 9001 | - | 0 | 0 | 0 | 0 | 0 | Haseko Corporation |
| Number of housing units that adopted Haseko’s Premium After-sales Service (Cumulative total) | - | 84,525 | 92,057 | 101,101 | 111,219 | 122,006 | Haseko Corporation |
Research and technology development
| Item | Unit | FY2021 | FY2022 | FY2023 | FY2024 | FY2025 | Calculation range |
|---|---|---|---|---|---|---|---|
| Research and development costs | billion yen | 3.92 | 3.31 | 3.82 | 4.20 | 3.89 | Haseko Corporation |
| Number of patents held | - | Intellectual property: Research and Technology Development | All Group companies | ||||
Social contribution activites
| Item | Unit | FY2021 | FY2022 | FY2023 | FY2024 | FY2025 | Calculation range |
|---|---|---|---|---|---|---|---|
| Amount of expenditure for social contribution activities | million yen | 571 | 106 | 564 | 251 | 237 | *1 |
| Total number of persons engaged in philanthropic activities | Total number of participants | 430 | 728 | 807 | 828 | 877 | *1 |
| Number of visitors to Haseko Condominium Museum | persons | 1,999 | 6,136 | 4,157 | 3,760 | 5,755 | - |
- Activities covering all employees in the Group are underway with Haseko Corporation as the representative company.
Governance Performance
KPIs in the HASEKO Evolution Plan Medium-Term Business Plan
Results for each item will be published from FY2025.
| Initiatives and KPIs | Target | FY2025 | Calculation range | |
|---|---|---|---|---|
| Respect for human rights | Implementation of human rights due diligence | Implement every FY | Implement every FY | All Group companies |
| Supply Chain Management | % of response for sustainable procurement questionnaire (Construction-related organizations of partner companies) |
Each FY 100% | 99.2% | *1 |
| % of engagement with foreign workers implementation rate (Based on number of target partner companies) |
Each FY 100% | 100% | *1 | |
- Companies participating in partner company associations of Haseko Corporation, Haseko Reform, Haseko Community, Fujikensetsu, and Hosoda Corporation
Corporate governance
| Item | Unit | FY2021 | FY2022 | FY2023 | FY2024 | FY2025 | Calculation range | |
|---|---|---|---|---|---|---|---|---|
| Institutional design | - | Company with corporate auditors | Haseko Corporation | |||||
| Number of Directors | Male | persons | 12 | 12 | 12 | 10 | 10 | Haseko Corporation |
| Female | persons | 1 | 1 | 2 | 2 | 2 | Haseko Corporation | |
| Number of independent Outside Directors | Male | persons | 4 | 4 | 4 | 4 | 4 | Haseko Corporation |
| Female | persons | 1 | 1 | 1 | 1 | 1 | Haseko Corporation | |
| Term of office of Directors | years | 1 | 1 | 1 | 1 | 1 | Haseko Corporation | |
| Attendance rate at Board of Directors’ meetings | % | 99 | 99 | 99 | 99 | 97 | Haseko Corporation | |
| Number of Corporate Auditors | Male | persons | 5 | 5 | 5 | 5 | 5 | Haseko Corporation |
| Female | persons | 0 | 0 | 0 | 0 | 0 | Haseko Corporation | |
| Number of independent Outside Corporate Auditors | Male | persons | 3 | 3 | 3 | 3 | 3 | Haseko Corporation |
| Female | persons | 0 | 0 | 0 | 0 | 0 | Haseko Corporation | |
| Term of office of Corporate Auditors | years | 4 | 4 | 4 | 4 | 4 | Haseko Corporation | |
| Attendance rate at Board of Auditors’ meetings | % | 100 | 100 | 100 | 100 | 100 | Haseko Corporation | |
| Number of members of Nomination and Remuneration Committee | Inside Directors | persons | 2 | 2 | 2 | 2 | 3 | Haseko Corporation |
| Outside Directors | persons | 5 | 5 | 5 | 5 | 5 | Haseko Corporation | |
| Attendance rate at Nomination and Remuneration Committee's meetings | % | 100 | 100 | 100 | 100 | 94 | Haseko Corporation | |
| Base salary, incentives, remuneration track record, etc. | - | Executive Remuneration: Corporate Governance | Haseko Corporation | |||||
| Shareholders’ rights: voting rights restriction | - | None | None | None | None | None | Haseko Corporation | |
| Anti-takeover measures installation | - | None | None | None | None | None | Haseko Corporation | |
| Number of Financial Auditors | persons | 3 | 3 | 3 | 3 | 3 | Haseko Corporation | |
| Unqualified opinions/notes on going-concern assumption in accounting audits | - | None | None | None | None | None | Haseko Corporation | |
Compliance / Risk management
| Item | Unit | FY2021 | FY2022 | FY2023 | FY2024 | FY2025 | Calculation range |
|---|---|---|---|---|---|---|---|
| BCP training participation rate | % | 100 | 100 | 100 | 100 | 100 | All Group companies |
| Compliance training participation rate | % | 100 | 100 | 100 | 100 | 100 | All Group companies |
Haseko Group's Sustainability
Related Data / Integrated Report
Special Features
- Human Capital / Human Resource Development
- Diversity & Inclusion / Labor Environment
- Occupational Safety and Health / Health and Productivity Management
- Enhancing Safety and Quality in Buildings and Services
- New Value Creation
- Community
- Research and Technology Development
- Social Contribution Activities